
An MTF (Modulation Transfer Function) graph shows how well a lens reproduces contrast.
Since Canon launched its RF45mm F1.2 STM lens on November 6th, it has sparked intense discussions, with the lens' MTF graph also becoming a focal point of attention.
Admittedly, we can't judge a lens' final imaging quality solely by a single graph. After all, as some people put it, "Pictures are for reference only; the actual product shall prevail." However, when there's no chance to test the physical lens in person, reading its MTF graph can still help you quickly get a rough idea of its imaging performance.
Below is a simple, non - rigorous explanation of how to read an MTF graph:
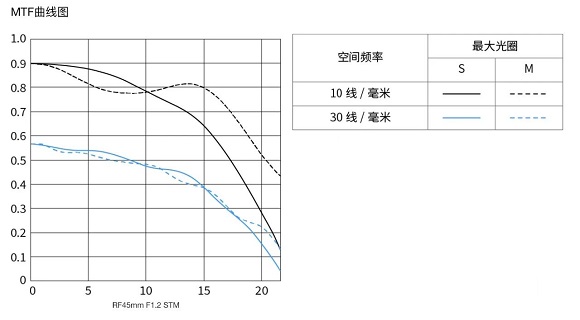
An MTF (Modulation Transfer Function) graph shows how well a lens reproduces contrast.
- Vertical Axis: Indicates the level of contrast.
- Horizontal Axis: Represents the distance from the center of the image.
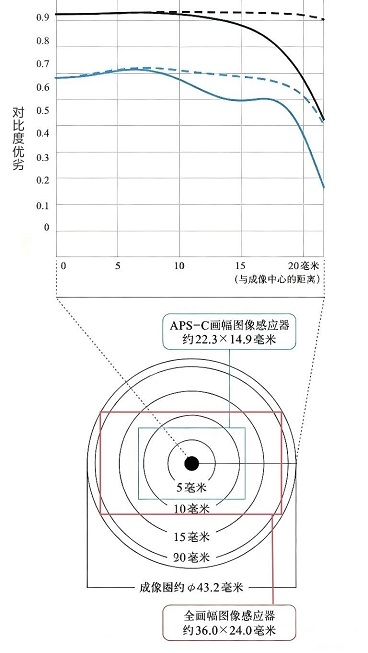
Here is an explanation based on Canon's official interpretation:
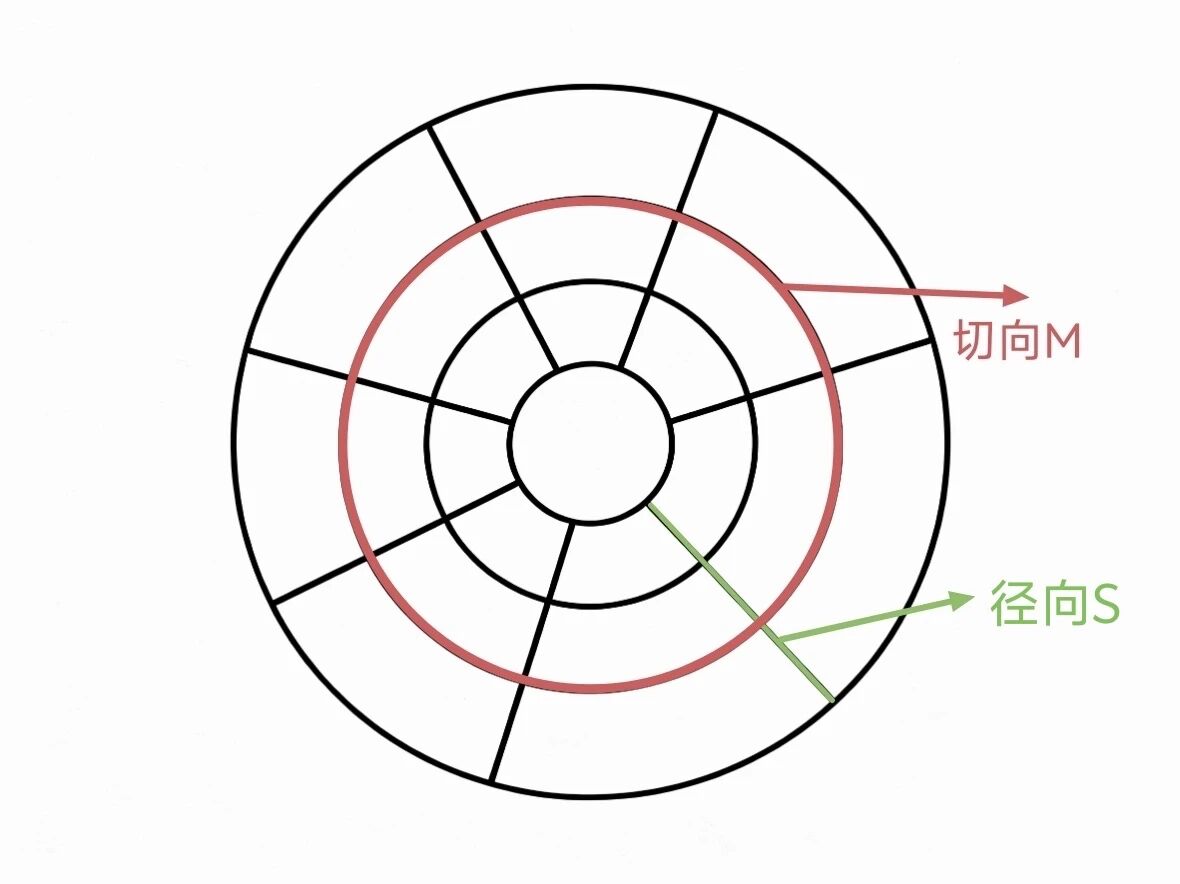
- Two Solid Lines: Marked with the letter "S", they represent the imaging performance when capturing radially - spreading patterns from the center. This is similar to Sony's Radial value (R).
- Two Dashed Lines: Marked with the letter "M", they stand for the imaging performance when shooting concentric circular patterns that expand outward. This is analogous to Sony's Tangential value (T).
A basic breakdown of the key metrics:
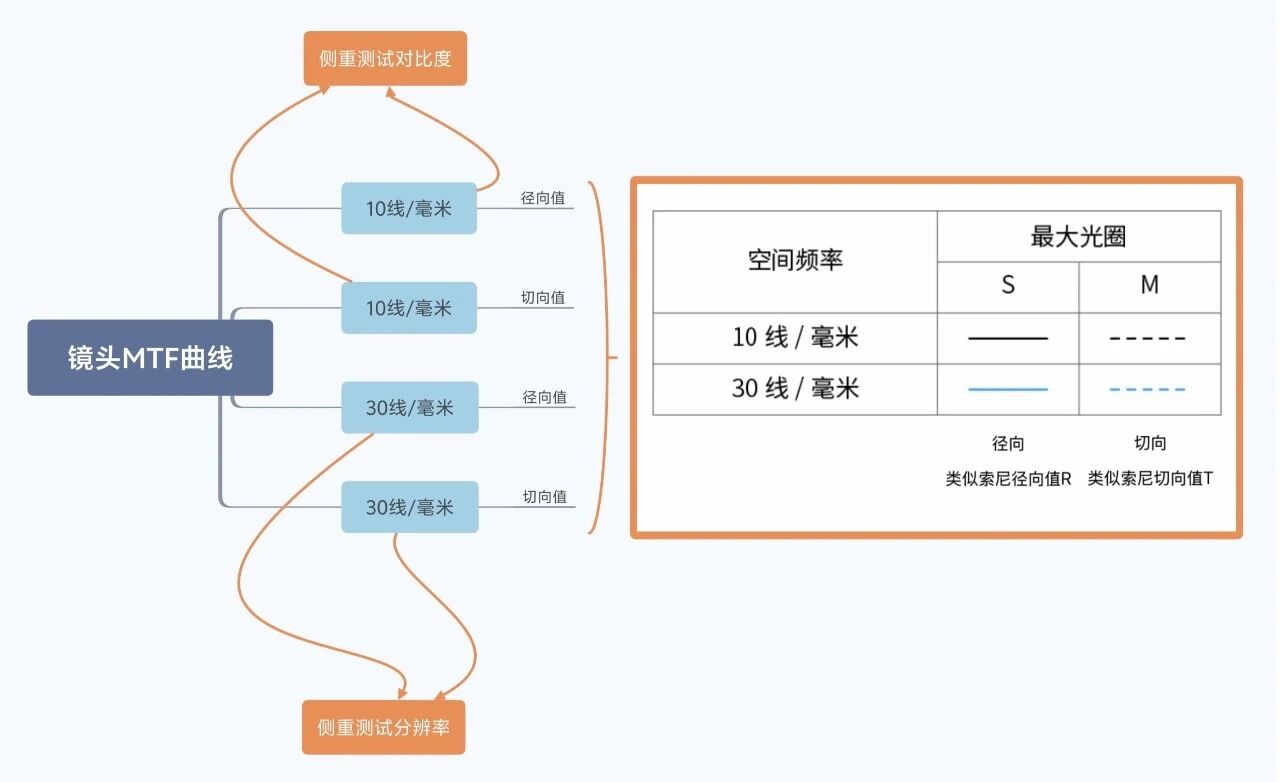
- 10 lines per millimeter: It can be understood as 10 alternating black and white stripes arranged within a width of 1 millimeter.
- 30 lines per millimeter: This means 30 alternating black and white stripes are placed within a 1 - millimeter width.
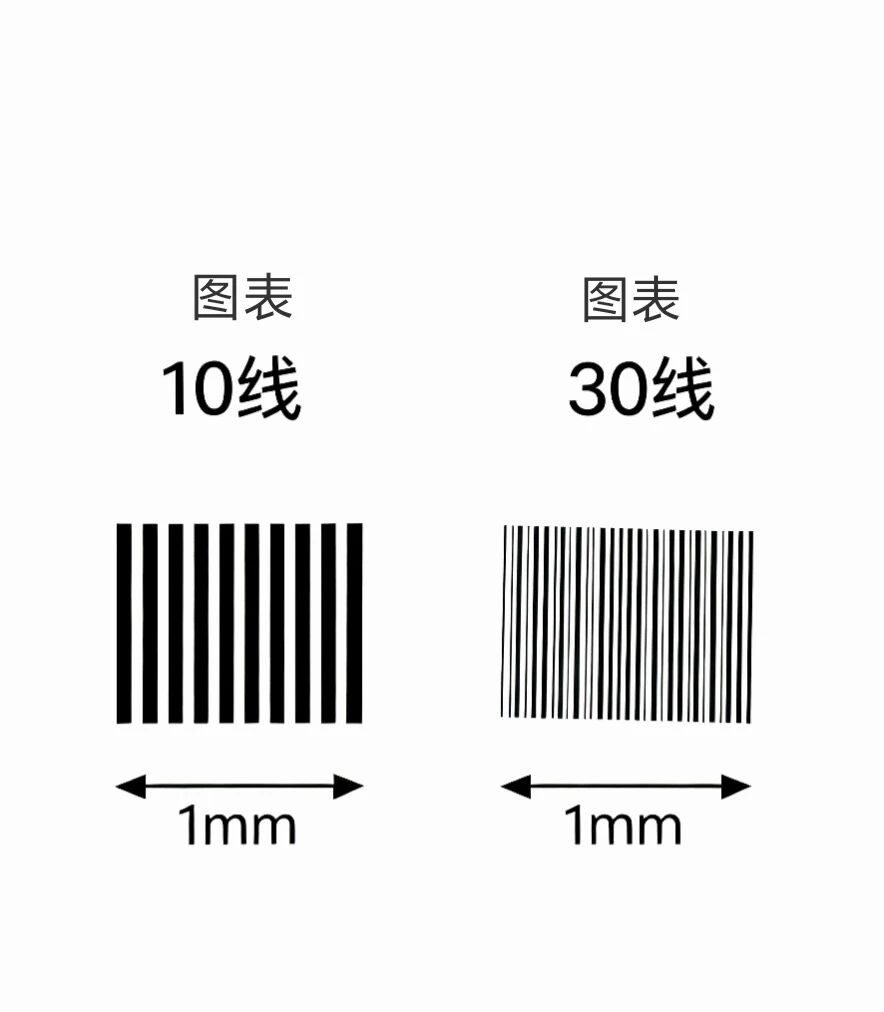
An important note on MTF testing: To measure MTF values, you need to photograph a chart printed with stripes of the above - mentioned densities, then measure and analyze the captured images to obtain the final data.
This may lead some photographers to ask: For the test, is it acceptable to only use the 10 - lines - per - millimeter chart and skip the 30 - lines - per - millimeter one?
The answer is no. Because the 10 lines - per - millimeter test focuses on contrast, while the 30 lines - per - millimeter test emphasizes resolution.
For zoom lenses, MTF values need to be measured separately at the telephoto and wide - angle ends. For prime lenses, measurements are generally taken at the maximum aperture and F8 aperture. These values allow you to roughly assess the lens' performance.
Now that we've covered the basic principles, here's how to quickly evaluate a lens using its MTF graph:
- Height: The higher the overall curves, the better the contrast and sharpness of the imaging.
- Flatness: A gently sloping curve from left to right indicates consistent image quality from the center to the edges of the frame.
- Closeness: When the solid lines and dashed lines are close to each other, it means the lens produces soft out - of - focus bokeh that fades smoothly like cream.
If a lens can meet (or come close to meeting) these three criteria, it will undoubtedly be an excellent lens.
-end-